Short-term ±5–15 cm oscillations are tidal residuals and are NOT geophysical.
Week-to-month trends reflect true magmatic inflation/deflation.
Source: PMEL/OOI · Rick Thomson tidal model · Updated once daily.
⊙ VECTOR WHEEL
—▲
Green needle = zone being loaded right now
Orange = Cascadia is the stress target
Red dashed = missed by 3-hr data gap
Fading arc = path the force swept through
Click a zone arc or canvas to light the wheel
▶ SWEEP
STEP
RESET
FORECAST TABLE
Select a date
✕
✕
Seismic Intensity Index
—
—
High Index
Top three Hazard Locations
Loading…—
Axial Volcanic Watch
Building
—
Days
Forecasted
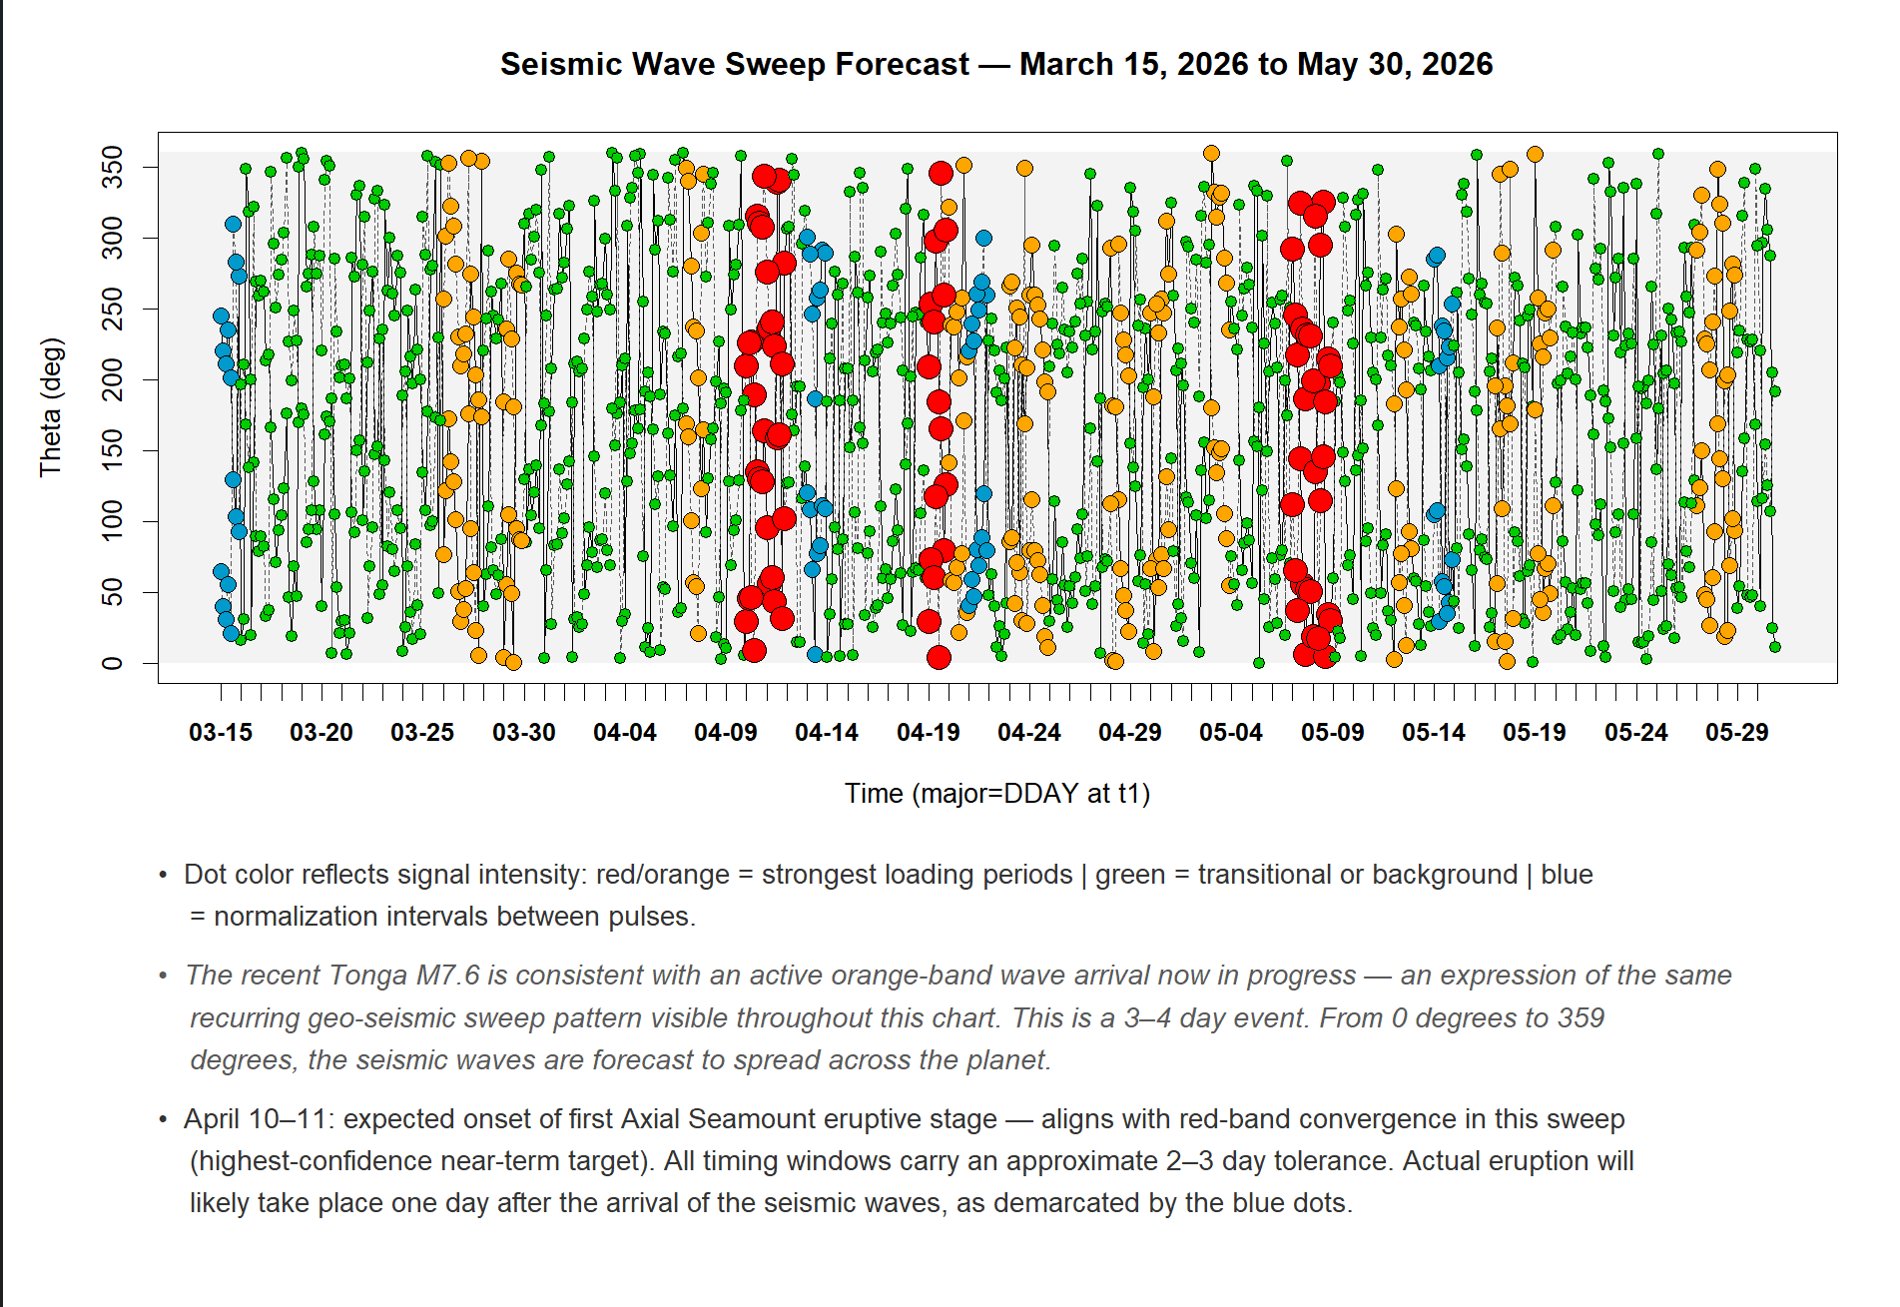
Axial Seamount eruption sequence begins
04-10-2026
04-11-2026
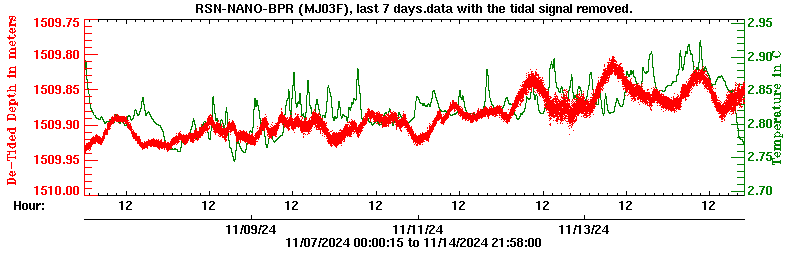
BPR Inflation Monitor
Axial Seamount · MJ03F · Live
📈
LIVE BPR FEED
RSN-NANO-BPR · MJ03F
Mar 26 pulse confirmed ✓
TAP TO EXPAND LIVE CHART
~1509.63 m currentTAP TO EXPAND ↗
RECOVERY
~2.87 m
TO THRESHOLD
~40 cm
Next Seismic Wave Forecast
—
WAVE INTENSITY —
Click the preview to expand the planetary sweep into the main viewing window.
ARC INDEX MONITOR
—
WORLD THETA VIEW
Affects WORLD view only. BOTH renders all θ1 and θ2 obliques.
OFFSET MODE
WORLD view only. EMPIRICAL uses fitted zone arrivals. REFERENCE 160 uses the uniform reference sweep.
AXIAL LIVE COUNT
GLOBAL EQ M≥0.5
CHECKING
--
24H EQ COUNT
MAX --
Source: live USGS query around Axial · waiting…
TODAY'S ZONE PROBABILITY
—
—
/ 100
SIGNAL INDEX
—
%
ZONE SHARE
—
/ 100
EFFECTIVE PROBABILITY
SELECTED DAY
Date—Level—Energy Index—Targeting—
MAR–MAY CALENDAR
◼ Blue◼ Green◼ Orange◼ Red
ENERGY LEDGER — 90-DAY DEFICIT
▬ Σ EI (loading)▬ Σ SRI (release)gap = stored debt
—
Blue = total stress the system has loaded into this zone since Mar 1.
Amber = total earthquakes actually released.
The gap between them is energy sitting quietly in the crust — loaded but not yet discharged.
A wide gap means the zone is under pressure. When the amber line catches the blue line, the zone has released what was loaded.
Cascadia's gap never closes — the fault is locked.
SIGNAL WINDOWS — SELECTED DAY
Select a date
SIGNAL BUBBLE LEGEND
EXTREME — AmpZ ≥2.5
HIGH — AmpZ 1.5–2.5
ELEVATED — AmpZ 1–1.5
MODERATE — AmpZ 0–1
Ellipse size ∝ energy index
Ellipse orientation follows fault strike